More NASA GISS temperature tampering, this time in Iceland & surrounding subarctic
More evidence of NASA GISS tampering with temperature data, this time from Iceland, where data from the Iceland national weather service shows no warming over the second half of the 20th century, in comparison to GISS data which cools the past to create a false warming of 0.5 - 1.0 C:
Google translation + light editing from the Swedish Stockholm's Initiative website:
12/17/2013 by CG Ribbing .
In this guest post, Magnus Cederlöf shows how GISS "homogenized" a constant temperature from the 1950's - 2000's in Iceland to a rising temperature. One is amazed at the craftsmanship! Figure 2-10-year averages from Akureyri [Data from the Iceland National Weather Service shown in blue, GISS data shown in green and red has cooled the past]
 Figure 3-10-year averages from Reykjavik [Data from the Iceland National Weather Service shown in blue, GISS data shown in green and red has cooled the past]
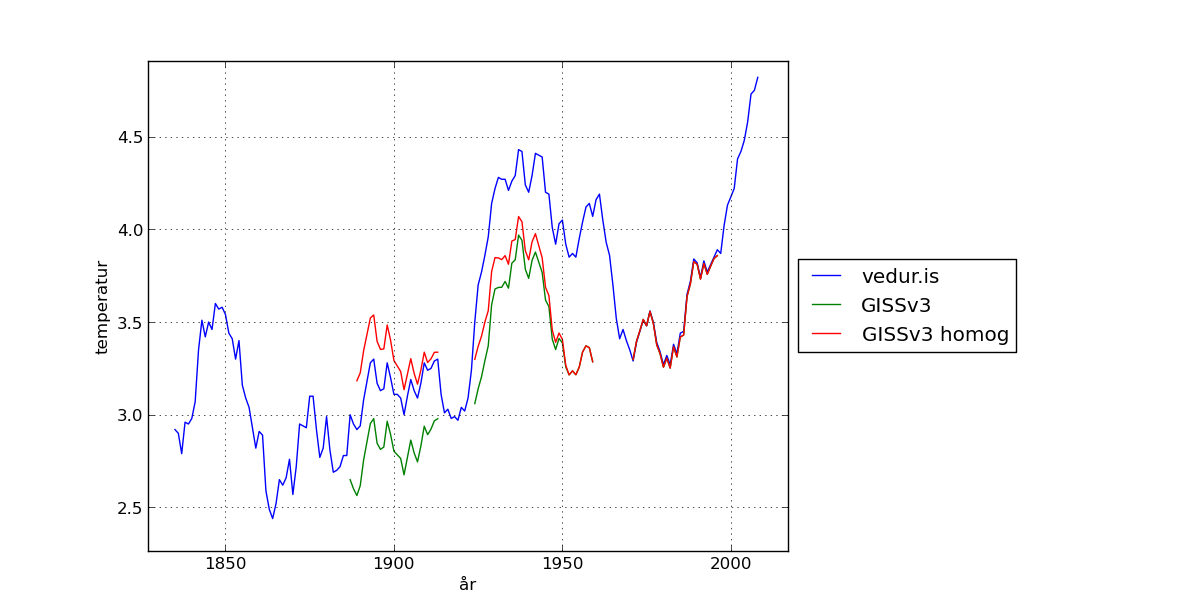
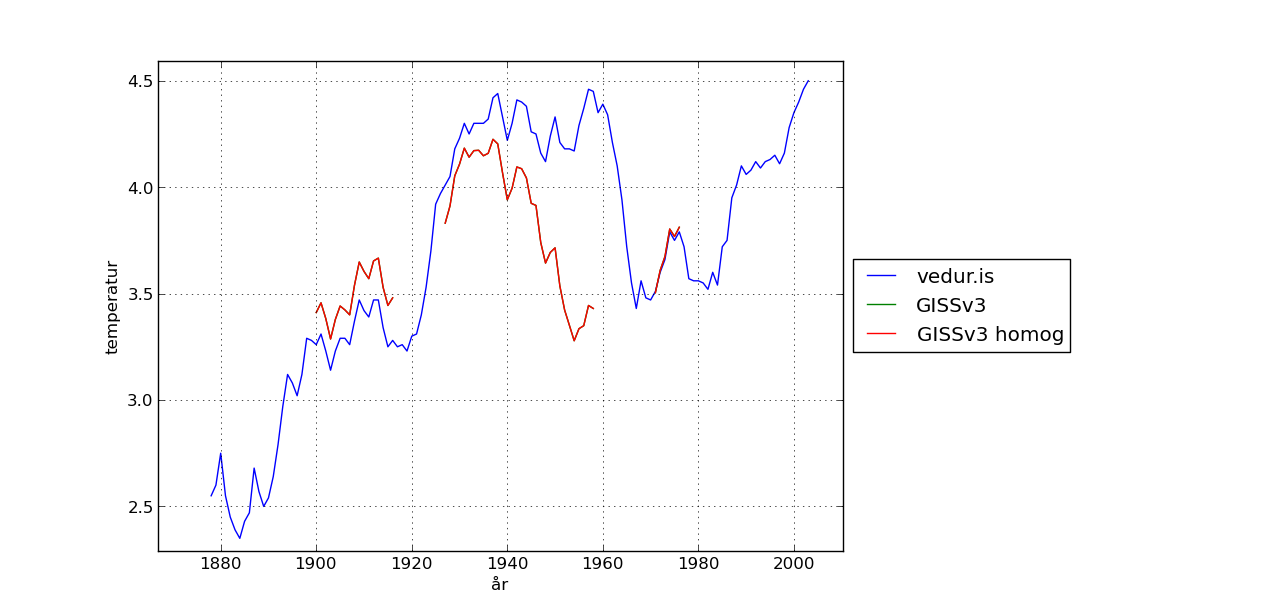 Figure 5 - 10-year averages from Teigarhorn
 Figure 6 - GISS estimate of the temperature rise between the decades around 1958 and 2000
Google translation + light editing from the Swedish Stockholm's Initiative website:
That "cool" Island
12/17/2013 by CG Ribbing .
In this guest post, Magnus Cederlöf shows how GISS "homogenized" a constant temperature from the 1950's - 2000's in Iceland to a rising temperature. One is amazed at the craftsmanship!
Temperature Adjustment for Iceland
By: Magnus Cederlöf
Several blog posts have dealt with temperature adjustments GISS for Iceland. See eg CG Ribbing post here or this from wattsupwiththat.com. I'll do this one more posts on this topic, where I compare the temperature series as Iceland's meteorological service (vedur.is) provides with those from GISS. GISS (Goddard Institute for Space Studies) is a research institute under NASA. GISS focuses on climate science and provide blah graphs and maps of temperature trends. The problem is that GISS has adjusted down the 1930's to 1940's warming period of the Icelandic temperature ranges. By doing so, it looks like the temperature has risen unnaturally over much of the past century. Using the Iceland National Weather Service data from vedur.is as the source, the development of temperature in Iceland is as follows.
Figure 1-10-year averages for a number of weather stations in Iceland according vedur.is *
All weather stations show similar trends. Therefore, one should not have to adjust the stations values very much. Below all Icelandic stations, which has a longer time series, from GISSv3 :
Figure 2-10-year averages from Akureyri [Data from the Iceland National Weather Service shown in blue, GISS data shown in green and red has cooled the past]Figure 3-10-year averages from Reykjavik [Data from the Iceland National Weather Service shown in blue, GISS data shown in green and red has cooled the past]
Figure 4-10-year averages from Stykkishólmur
Figure 5 - 10-year averages from Teigarhorn
The upshot of this is that GISS has lowered 1930's-1940's warm period in all temperature ranges. One could imagine that homogenized data so that some stations may be increased temperature and reduced temperature. But that is not the case. However, the curves show that the G SHARP call homogenized both reduced and elevated temperature if compared with the data from the homogenized series G SHARP. There are also significant gaps in the GISS data. These gaps are not in the data from vedur.is.
When dealing with the measurement data in this way, one can wonder about whether it is possible to draw any conclusions from them. Because they also often use nearby stations to extrapolate to areas where no stations exist, it is particularly serious that at temperatures from Iceland have been manipulated in this way. There are large sea areas around Iceland that these errors propagated to. To illustrate how wrong it is, one can use the function on GISS website to draw maps of temperature trends. If one considers Figure 1 we see that in 1958, the temperature is about as high as in 2000 (10-year averages). Feed it up a 10-year span around the year 1958 and compare it with a 10-year span around 2000 to get the GISS data, the following picture results:
Figure 6 - GISS estimate of the temperature rise between the decades around 1958 and 2000
GISS shows that the temperature rise in most of the Iceland should have been between 0.5 and 1 degrees. Iceland's own weather reports now show that the temperature increase between these years was zero . This image from GISS is understandable to the uninitiated, but it is also completely misleading. It is not only that Iceland is wrong. Presumably, the error propagated to a large part of the ocean around Iceland. One can then also wonder how many other areas that have similar errors.
* Footnote: There are two temperature ranges for each station on vedur.is. One very long time series, but ends in 2000, and the other has shorter time series and ends about the year 2008. These data sets are merged, although they do not have exactly the same values for overlapping times. The difference is within a few tenths of a degree and therefore does not affect the conclusion of the analysis.
One little point - it is in fact GHCN that do the adjustment that cools the past, not GISS. See for example this page from GHCN for Reykjavik
ReplyDeleteftp://ftp.ncdc.noaa.gov/pub/data/ghcn/v3/products/stnplots/6/62004030000.gif
The top right graph in red is the raw data, which looks like the graphs shown here, with a cooling from 1940-1980.
The graph below that (yellow) is the adjusted data, in which that cooling has disappeared.
Paul Matthews
Thanks Paul
Delete